Continuous CO2 Monitoring with Raspberry Pi, CO2-mini, and Zabbix: A Complete Setup Guide
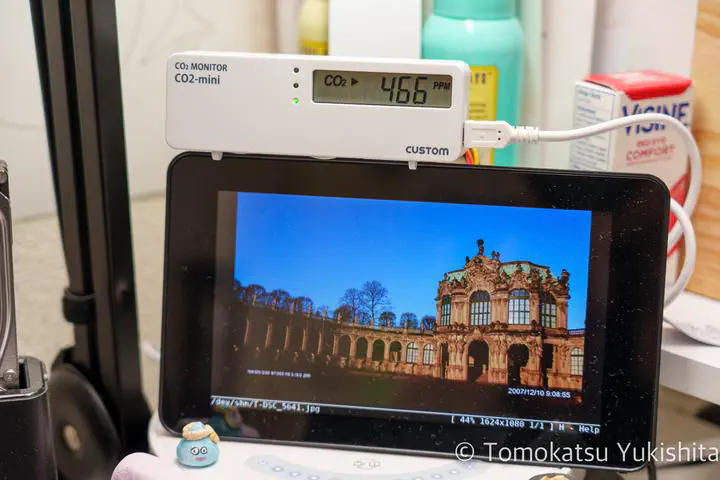 Image credit: Tomokatsu Yukishita
During the COVID-19 pandemic, I bought a CO2 monitor — the CUSTOM CO2-mini. It runs on USB power, and as it turns out, it can also communicate over USB. I connected it to a Raspberry Pi and set up Zabbix to continuously monitor indoor CO2 levels. Here is the full setup guide.
Hardware
Raspberry Pi

CO2-mini (CUSTOM CO2 Monitor)

Power Supply and microSD Card


Reading Data from the CO2-mini (Python)
When you connect the CO2-mini to a Raspberry Pi via USB, it is recognized without any special drivers. Data retrieval uses the heinemml/CO2Meter Python library.
Installing the Library
On Raspberry Pi OS Bookworm (2023 and later), installing packages directly into the system Python with pip is restricted. Use a virtual environment instead:
python3 -m venv /root/co2env
/root/co2env/bin/pip install git+https://github.com/heinemml/CO2Meter
sudo pip3 install ... may fail with an “externally managed environment” error. Using a virtual environment as shown above is the safe approach.Script: Writing CO2 and Temperature to Shared Memory
To make values accessible to the Zabbix agent, the script continuously writes them to files under /dev/shm/.
from CO2Meter import *
import time

sensor = CO2Meter("/dev/hidraw0")  # may be hidraw1 or similar on your system

while True:
    time.sleep(1)
    data = sensor.get_data()
    if 'temperature' in data and 'co2' in data:
        with open('/dev/shm/co2', 'w') as f:
            f.write(str(data['co2']))
        with open('/dev/shm/temperature', 'w') as f:
            f.write(str(data['temperature']))
/dev/hidraw0 may differ on your system. Run ls /dev/hidraw* to find the correct path after plugging in the CO2-mini.Auto-start at Boot (crontab)
The device requires root access, so create a shell script that runs as root:
/root/co2.sh
#!/bin/bash
sleep 5
/root/co2env/bin/python3 /root/co2.py
Add to root’s crontab to run at boot:
@reboot /root/co2.sh
Zabbix Configuration
The approach is:
- The Python script continuously writes CO2 and temperature values to
/dev/shm/ - The Zabbix agent reads those files via
catand returns the values
Zabbix Server: Creating the Host and Items
Install the zabbix-agent on the Raspberry Pi and add it as a host in Zabbix server.
Create two items — one for CO2 concentration and one for temperature.
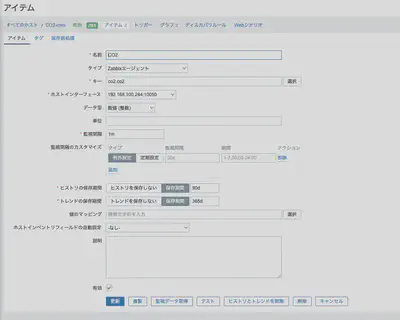
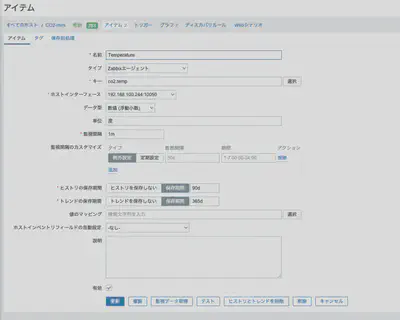
Use the following item keys:
co2.co2   (CO2 concentration)
co2.temp  (Temperature)
Zabbix Agent: Configuration File
Edit /etc/zabbix/zabbix_agentd.conf to set the server address:
Server=<zabbix-server address>
ServerActive=<zabbix-server address>
Include=/etc/zabbix/zabbix_agentd.conf.d/*.conf
UserParameter Configuration
Create /etc/zabbix/zabbix_agentd.conf.d/userparameter_co2.conf. It simply cats the shared memory files:
UserParameter=co2.co2,cat /dev/shm/co2
UserParameter=co2.temp,cat /dev/shm/temperature
Restart the agent:
sudo systemctl restart zabbix-agent
Results
CO2 concentration and temperature are now graphed in Zabbix.

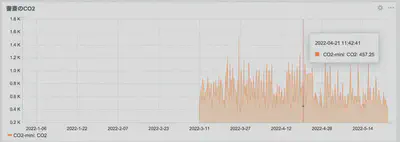
Since setting up the monitor, I ventilate much more frequently. Seeing the numbers makes it obvious exactly when ventilation is needed.
Summary
| Component | Role |
|---|---|
| CO2-mini | Measures CO2 concentration and temperature via USB |
| Raspberry Pi | Reads sensor data and writes it to shared memory |
| Python (CO2Meter library) | Communicates with CO2-mini and parses data |
| Zabbix (agent + server) | Collects data, graphs it, and stores long-term history |
The complete scripts are available on GitHub:
GitHub - yukishita/co2-mini: Program to log CUSTOM CO2-mini data with Zabbix
Tomokatsu Yukishita (雪下 智且)
Engineering Manager / Real Estate Transaction Agent
Engineering manager connecting embedded development with cloud and AI. I apply quality standards from mission-critical systems to modern product and development workflows.